Infographics
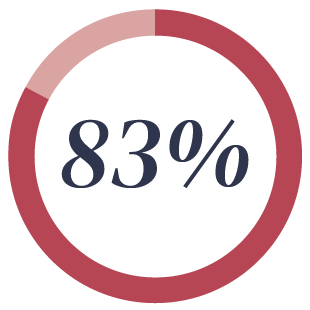
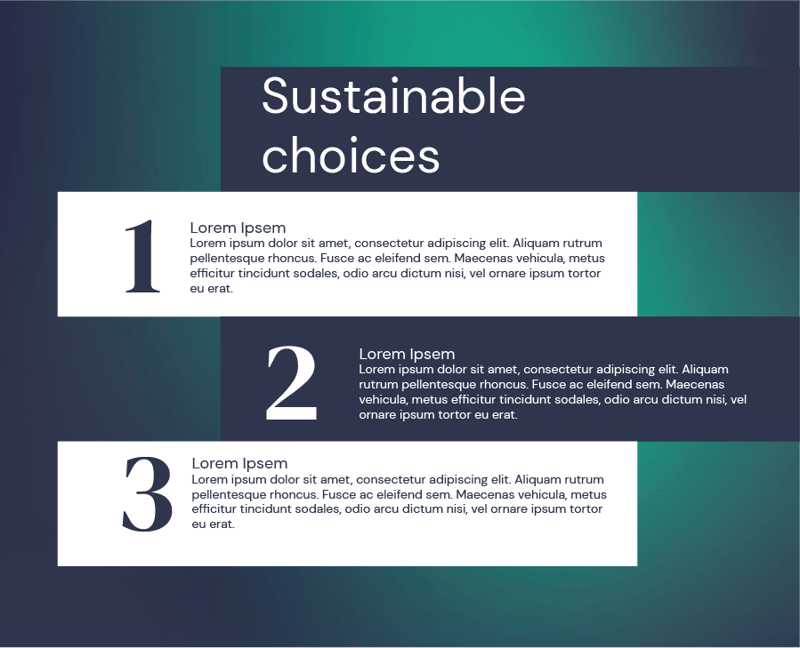
Infographics enable us to break down content and make it more digestible and visual. Having a consistent approach to infographics will create cohesion across all communications. We can utilise all of our brand elements to create varied types of infographics as illustrated by the examples on this page.
When creating infographics use the key principles below.
Charts and graphs

Tints of colour used within graphs and charts

DM Serif Display Italic used to highlight key stats
Graphics
Gradients add depth and texture to infographics

Linear diagrams, icons and numbers reflect refined graphic patterns
Content is placed within dynamic blocks


